A step further with DocReview, our AI solution for extracting information from documents: processing tables
DocReview, one of Sia Partners' AI solutions, automatically reads thousands of documents of any format (pdf, scan, etc.) and extracts the key information they contain.
Until now, it has not been easy to extract the information contained in tables present in unstructured documents.
And yet the need was felt by our customers.
This is now possible thanks to the combination of several algorithmic approaches that we will present in this article.
Building on the success of our AI solution DocReview on the analysis of nearly 8,000 company agreements registered by the Ministry of Labor between 2018 and 2021 to carry out a study on the rise of teleworking for “Les Echos”, we wanted to further enrich the capabilities of our tool.
The emergence of a new need on Doc Review
Whether in the field of banking, insurance, real estate or any other sector, a large part of the data to use is contained in the tables present in the documents ( pdf, scan…).
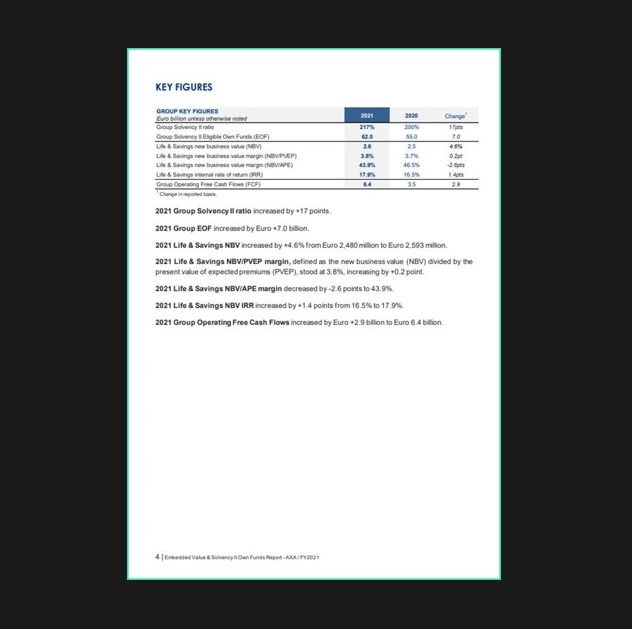
For the proper understanding of the article, we will illustrate our examples with AXA’s Solvency II intrinsic value and equity ratio. A typical page of this report contains one or more tables and text, as shown below:
It therefore becomes essential to structure the information from the tables and to be able to extract it to capture all the information contained within unstructured documents.
Nowadays, with technological advances in the field of computer vision and natural language processing, obtaining data from tables and images has become possible, using an unsupervised approach.
Pipeline for processing tables
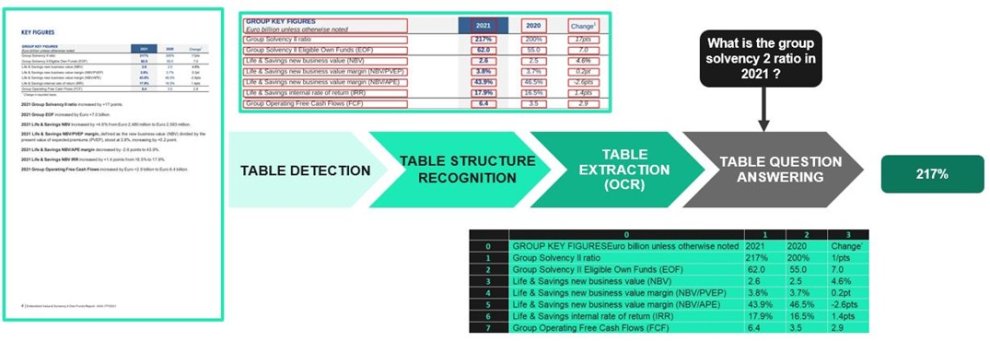
Table processing is divided into four main steps: detecting the table, recognizing its structure, extracting the table (OCR of identified cells), and finally obtaining answers from questions asked in natural language.

Step 1: Detect tables in an image
To process a document, a pdf (scan or text) for example, we convert it into a set of images corresponding to each page. Of course, before proceeding with the detection, it will be necessary to carry out a “preprocessing” step to prepare the image and obtain better results during detection.
Table detection is the process of identifying areas where tables are located within an image. Recent advances in computer vision, combined with increasingly large datasets, make it possible to obtain good results.
There are open-source packages on Python to detect tables like Camelot, tabula, pdf plumber etc. In most cases, the most efficient remains Camelot which also carries out the extraction of the table.
Camelot has 2 methods to perform extraction: “Lattice” and “Stream”. “Lattice” is used to analyze tables that have delimited rows between cells, while “Stream” is used to analyze tables that have blank spaces between cells to simulate a table structure. But it is up to the user to select the method to implement, i.e. there is no automatic classification in Camelot. In addition, these packages are unable to process pdf scans. More general solutions need to be found.
Most methods of detecting tables in images today are based on “deep learning”, by adjusting a pre-trained model for detecting objects such as Faster RCNN, Cascade R-CNN or Cascade mask R-CNN, on datasets created specifically for this task (cTDaR, Marmot, …).
Thus, it is possible to detect tables. Nevertheless, there is a wide variety of tables that cannot be treated with this approach when it comes to recognizing their structure. They should therefore be classified.
Step 2: Detect and classify tables in an image
Beside detection, other methods can be used to classify tables into several types. This is particularly the case with CascadeTabNet, which is capable of detecting and classifying two types of tables: “bordered” and “borderless”. A “bordered” table © is a table for which an algorithm can only use its rows’ positions to estimate the cells and the overall structure of the table. A “borderless” table(a) is a one with no rows. There is are also the “partially bordered” table (b), halfway between the first two types.
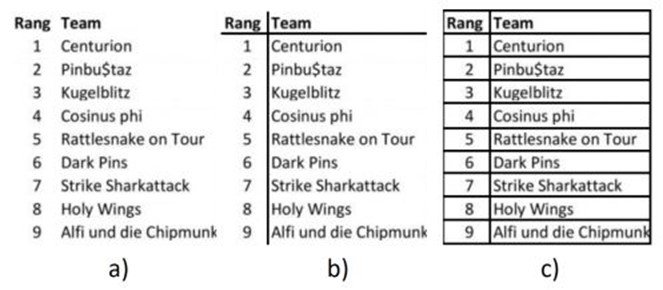
If we go back to our example mentioned before in figure 1, the selected page contains the following table which has been classified as borderless.

Step 3: Recognize the structure of a table
Recognizing the structure of a table consists in identifying its rows, columns, and cells as well as their coordinates.
There are several approaches to address this complex challenge: rule-based heuristic approaches to recognize or analyze table structures from visual signals (Multi-type-TD-TSR), deep learning-based approaches (DeepDeSRT, etc.), and others based on graph convolutional networks (GraphTSR, etc.).
The approach presented in Multi-type-TD-TSR — inspired by the work done in CascadeTabNet — is based on a combination of rules applied to the table’s image. It treats tables differently: “bordered”, “borderless”, and “partially bordered”.
Two main operations are used to determine the structure of a table: dilation and erosion. Unlike dilation, erosion causes the light areas of the image to thin while the dark areas enlarge. Erosion is used on “bordered” tables to detect vertical and horizontal lines, which must be preserved, while removing characters from table cells. Dilation, on the other hand, is applied successively to restore the original structure of the table since erosion shortens the lines. In addition, erosion is applied to borderless tables to add missing rows, and thus reconstruct the table explicitly.

Once the structure has been identified, it is necessary to determine what is written in each of the table’s cells. This is where OCR (optical character recognition) comes into play. At the end of this operation, we get our final excel formatted table.

Step 4: Answer questions in natural language
Once our table is transformed into xlsx, we must be able to extract information based on a query or question in natural language.
The TAble PArSing (TAPAS) model created by Google is the most used to answer natural language questions over tables. In a nutshell, TaPas trains from weak supervision and predicts the final response by selecting table cells and possibly applying an aggregation operator corresponding to that selection. TaPas extends the architecture of BERT to encode input tables, initializes from a joint pre-training of text passages and tables crawled from Wikipedia with an end-to-end training.
Haystack offers an implementation of this model using a function called TableReader. It is therefore possible to build a pipeline, using TAPAS, taking as input an excel file and a question, and outputting an answer. Simple questions can be asked that require only one cell to be selected. For example: “What is the Group Solvency 2 ratio in 2021?”, or “What was the Group EOF in 2020?”.
TAPAS predicts the final response by selecting table cells and optionally applying an aggregation operator (sum, count, average or none) to the selection, as explained earlier. It is therefore possible to ask more complex questions. For example: “What is the average Group Solvency 2 ratio during 2020–2021?”.
Some documents contain several tables, as is the case on the report taken as an example in this article. We will therefore adopt a 2-step approach: identify a subset of tables for which we have a good chance of obtaining the desired answer, then ask the question on this limited set, and keep the best answer.
The whole pipeline in one image
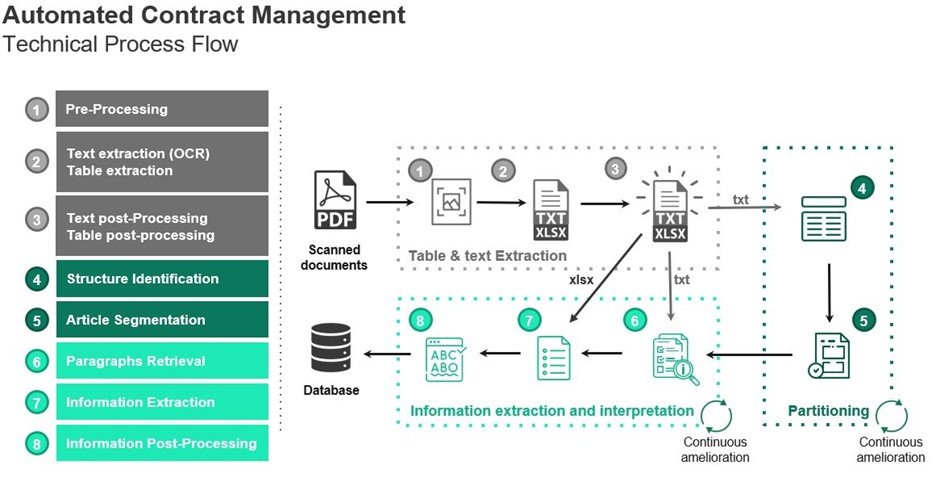
Integration of table processing within Doc Review
This pipeline only allows us to extract the information from tables illustrated in images, but our main interest remains the extraction of the information from the entire document, text and tables combined.
When we try to answer a question in a text, we first retrieve candidate passages and then extract the correct answer among these candidates. A similar approach should be taken with tables and text combined. Deepset managed to propose an adapted solution by jointly coding texts, tables and questions into a single vector space.
Haystack also proposed an implementation for this specific case called the TableTextRetriever, which can be inserted into a pipeline to find candidate passages and tables from which it will extract the final answer. We can thus take as input to our pipeline a question in natural language, the text from the OCR, the tables found in xlsx, and get the desired answer regardless of its location in the document (table, text passage, etc.)
Conclusion
We are now able to extract information from a document with text and tables, and also answer questions asked by a user, all in an unsupervised way.
Doc Review is a complex artificial intelligence capable of extracting key information from documents. Several approaches to computer vision and NLP (Natural Language Processing) had to be used and combined in order to achieve our goals. The combination of supervised and unsupervised machine learning allows the user to achieve excellent results without providing a database, and then improve the accuracy and specificity of the algorithm using the supervised part.
If you would like to know more about our solution, please do not hesitate to contact us.


