Understanding the customer purchase journey with visualization and clustering
Analyzing customer journeys, especially purchase journeys, is an essential step in marketing analytics to understand how customers perceive and interact with a brand's products and services.
Exploring customer purchase journeys allows brands to obtain granular insights and optimize and improve future customers' experience,e.g., by recommending or communicating about these items to customers with similar journeys.
This customer purchase journeys analysis has several purposes:
- Build a global and synthetic vision of all customer journeys
- Identify the main categories of customer journey
- Identify the virtuous paths (or essential products) that generate value and loyalty
- Conversely, identify the negative paths that lead to loss of customers
- Identify product interactions that generate cross-sell
However, given the increasing size and complexity of customer journey data, meeting these objectives is not an easy task, and it is difficult to extract relevant information from fragmented journeys. To give a rough idea of the size, a brand that offers 100 different products for purchase (which is not huge) and would like to analyze customer journeys of 10 subsequent (which is not huge either) would therefore have a possible number of different customer journeys of the order of 1019 (without even taking into account the possibilities of buying several products at the same time at each stage).
Thus, standard analysis methods (such as journey mapping) are often outdated to exploit the full richness of customer journey data. Using more advanced techniques from machine learning and deep learning became necessary.
In this article, we will describe two methodologies to take advantage of customer journey data:
- The use of process mining to build a synthetic view and extract useful information from customer journey data to facilitate decision-making
- A customer journey clustering methodology based on autoencoder neural networks and clustering algorithms
1) Customer journey visualization with process mining
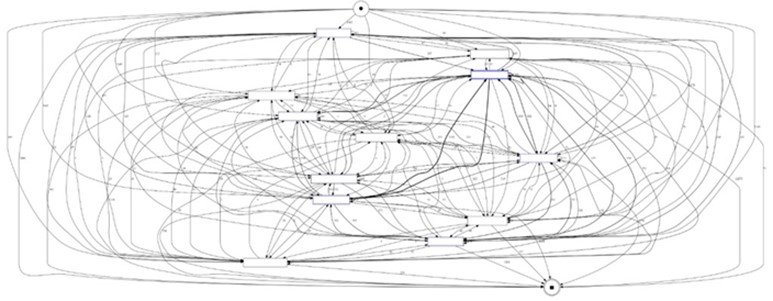
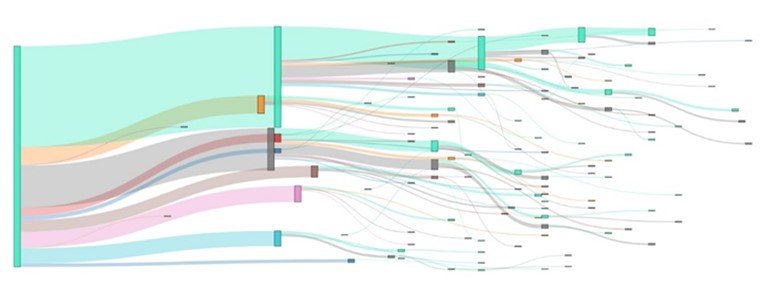
When analyzing customer journeys, the first step is usually to obtain a global visualization. However, given the size and complexity of data, building an exhaustive visualization of all the journeys often results in complex and unreadable representations. For example, suppose we use classic visualization methods such as directed graphs and Sankey Diagrams with complex artificial customer journey data. In that case, graphics are almost illegible:
However, there is a set of algorithms specially designed to visualize these types of complex process data (i.e., a series of events) and extract insights: Process Mining. It is a set of methods that allow for building a synthetic vision and extracting useful information from process data to facilitate decision-making.
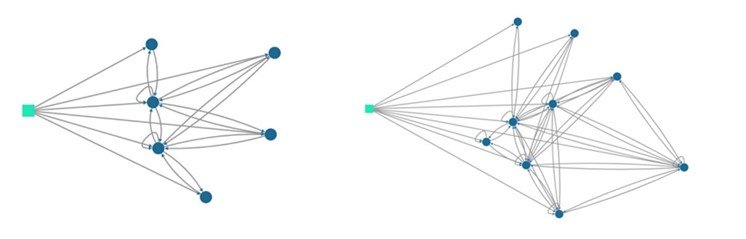
One of the primary process mining algorithms is the Heuristic Miner. It is an algorithm that uses a statistical approach to extract dependency relationships between actions taken over time. Thus, using this algorithm with the same artificial data as before can derive new synthetic representations from different algorithm settings:
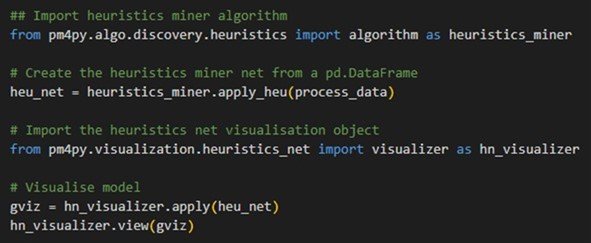
A handy Python library allows using the main Process Mining algorithms: pm4py. In the case of the Heuristic Miner, the algorithm can be applied very quickly to a dataset in a few lines of code:
In the context of customer purchase data, these visualizations are very useful to construct a global vision of the customer journey, identifying critical products, virtuous paths, main dependencies between different products, cross-sell between product groups, and so on.
For example, with purchase path data in which we do not take into account the order of the purchase (each product is thus associated with a single node in the graph, contrary to the Sankey Diagram), the use of the Heuristic Miner (set to a certain degree of simplification) makes it possible to identify the “bridge products” in our data.
2) Customer purchase journey clustering
Customer journey clustering is an approach that uses algorithms analyzing journeys to identify groups of consumers who have similar purchase behaviors. These clusters make it possible to improve and personalize the customer experience.
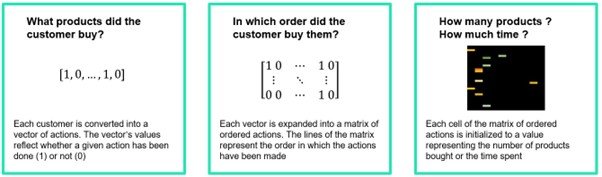
We took inspiration from the image clustering methodologies, which represent each image with a matrix of pixels recorded as intensity values of specific colors (e.g., shades of grey). This approach has three steps:
- Representation of each purchasing journey with a matrix of action
- Dimension reduction of the purchase journey dataset with autoencoder neural networks
- Clustering and calculation of the centroids of each cluster
Representation of each purchasing journey with a matrix of action
To group similar purchase journeys together, it is necessary to consider the products purchased by each consumer, the order in which these products were purchased and possibly different values (e.g., the number of products purchased, or the time elapsed since the previous purchase). For this purpose, each purchasing journey is represented with an "image" or "matrix of action":
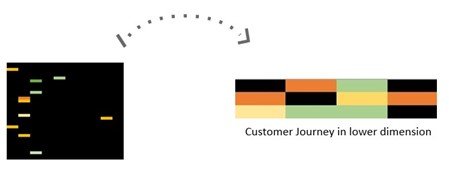
Dimension reduction of the purchase journey dataset with autoencoder neural networks
The dataset obtained in the previous step is substantial and sparse. A dimension reduction algorithm keeps only the relevant information for future clustering. The images are processed in an autoencoder neural network. The Python Keras library provides the tools to set up the model. We can also use PCA (Principal Component Analysis)
Clustering and calculation of the centroids of each cluster
Finally, from the low-dimensional images created previously, a clustering algorithm is used (such as the DBSCAN or HDBSCAN algorithms of the sci-kit-learn library) to create groups of similar purchase journeys. Each cluster's average purchase journey (centroid) is then calculated and returned in high dimension.
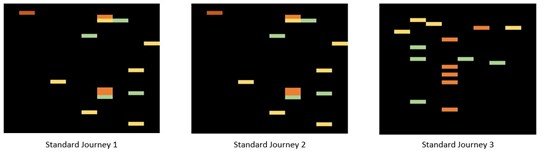
Each cluster is thus represented by a "typical" purchase journey allowing us to identify the main trends in customer paths.
Conclusion: feedback
To conclude the presentation of these two methodologies, we implemented them with an actual purchase path database. The number of paths was around 50,000, the number of purchases in each path was between 1 and 10 (with a solid majority of single purchase paths: 90%), and the number of different products was 172.
The use of process mining has proven to be very successful and has given us easily usable results. Indeed, given the volume of data, it was difficult to visualize the overall purchasing pathways using traditional methods such as directed graphs or Sankey diagrams.
On the contrary, process mining allowed us to obtain a global visualization (by parameterizing the algorithm according to the desired level of detail) and to identify the main links and synergies between each product.
The customer journey clustering methodology could have provided more valuable results. An insignificant portion of the data was clustered, while the rest was considered noise. In addition, the clusters only identified customers' journeys according to the first product purchased or customer journeys where the customers purchased the same products several times in a row. The main reason for this negative result is the low number of customer journeys with more than one purchase (10% and 3% for trips with more than two purchases) and the large number of products that can purchase at each stage of the journey (172). Therefore, the algorithm needs more long journeys to distinguish and group them, except for those in which the same products are purchased repeatedly. We could obtain much better insights with more extensive and richer data with more complex journeys and retention paths.